The Dataset
The dataset for this project was provided by MovieLens, which is run by GroupLens, a research lab at the University of Minnesota. MovieLens offers a handful of easily accessible datasets for analysis. For this project, we used their 100k dataset, which is readily-available to the public here:
Before beginning analysis and building a model on a dataset, we must first get a sense of the data in question. We’ve found previously that datasets are often skewed, whether it's a result of improper observation methods or a myriad of other factors, so gathering initial statistical data is the first step in building any form of predictive model, as this will give as indication as to the reliability of the data we are basing our predictive models on.
The MovieLens dataset has just over 100,000 ratings on 9,100 movies from 671 unique reviewers. So, on the whole, we should be looking at around 10 reviews per movie with an average of 150 reviews per user (quick math). The 100k dataset is a scaled version of the entire dataset available from MovieLens and it is specifically designed for projects such as ours. It is important to note that we expect our project results, using this dataset, to hold even with additional observations. For instance, if the model is tested using the larger dataset at a later time, the results should be similar to the test set we used on the smaller 100k dataset.
Each observation in our dataset contains a variety of information: a unique movieID(an integer value) to identify the movie in question, the title of the movie(a string with the year of production on the end), associated genres for the movie(a string of values separated by a ‘|’, in which there is a one-to-many relationship - one movie may have multiple genres), a unique userID (an integer that identifies a reviewer), a rating of the movie by the reviewer (a float which can range from a 0 to 5.0, within .5 increments), a timestamp for the review (ISO 8601, milliseconds since epic format), and tags (which consist of a string that a reviewer might use to describe the movie or their review).
When exploring data, it’s always best to get a sense of the range, mean, and frequency of values at the very beginning to determine if there is any readily apparent skewing of results or obvious trends. We did this both from the perspective of the movies (computing and visualizing average ratings, the frequency of rating, etc.) as well as from the reviewer’s perspective (reviewer’s average ratings, highest average ratings, frequency of ratings, etc.). We found that the mean rating for a movie by a reviewer was 3.54. We can use the closest value to the mean (3.5, or rather, 3.5/5.0) as our simplest (naive) baseline prediction. This mean can be used to sanity check our models as we progress to that stage. Afterall, any predictive model should perform better than the mean of the dataset.
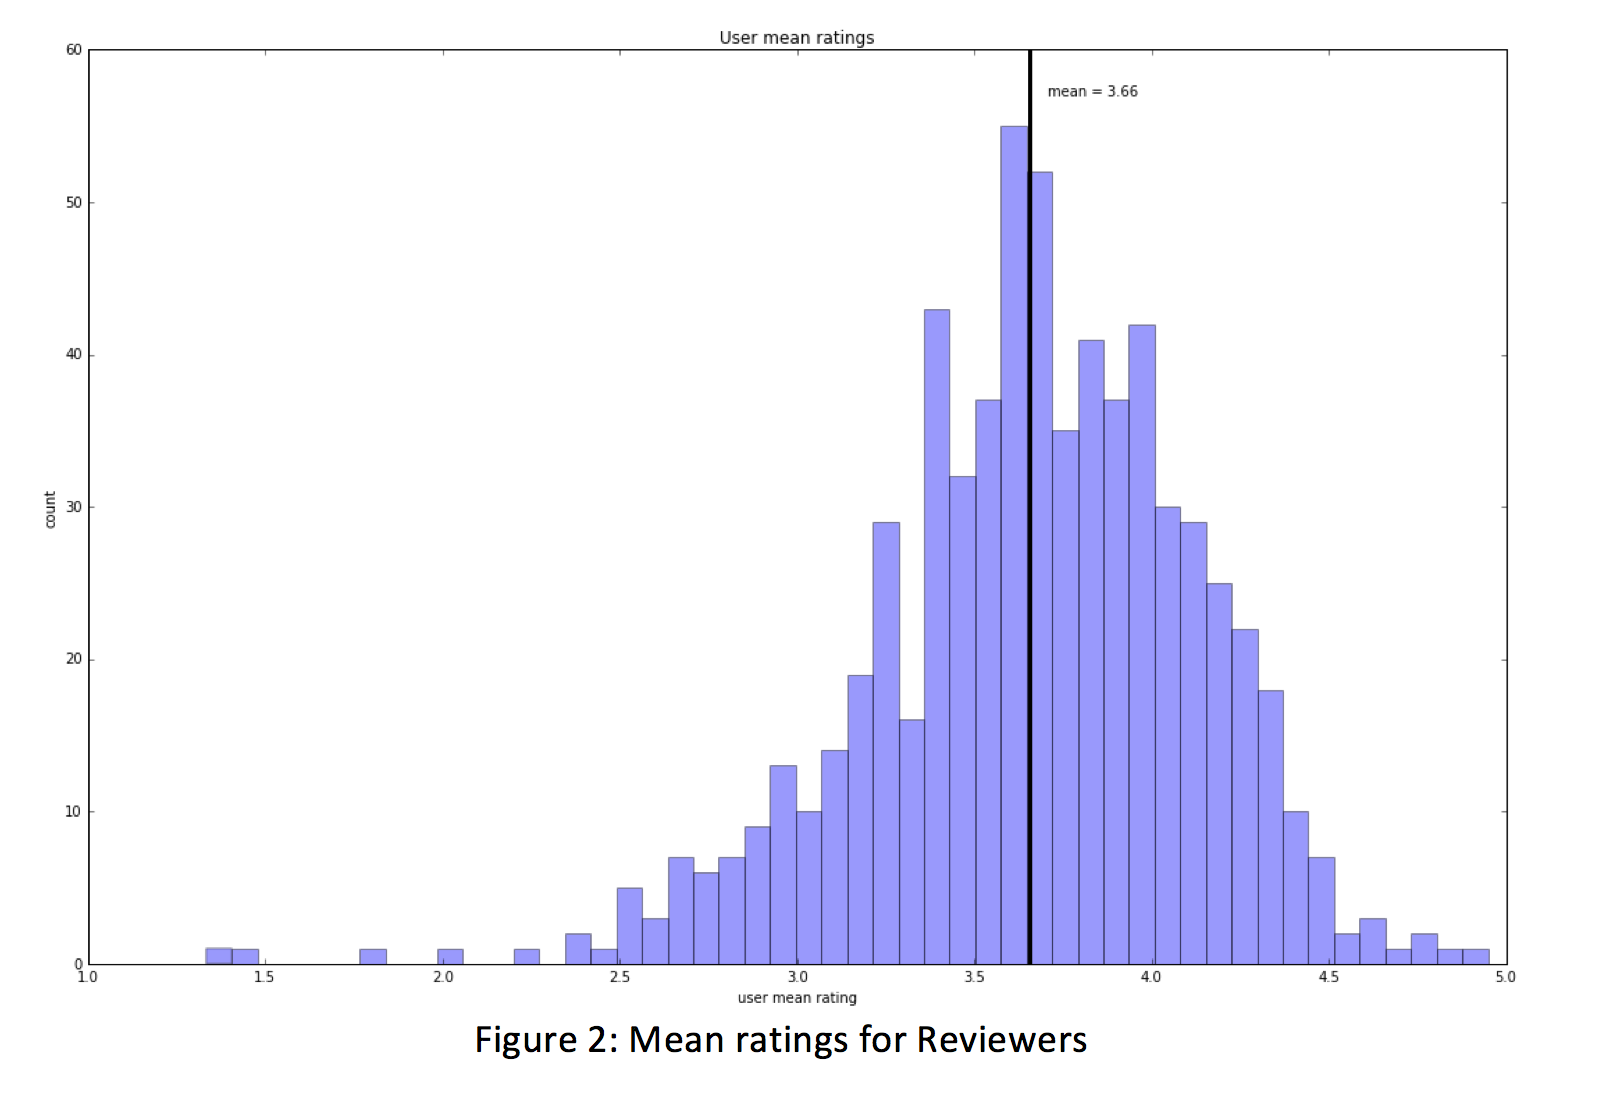
Looking at the data from the reviewer’s perspective, we find out some interesting information about the dataset; there appears to be large range for the number of ratings that a user might submit. For instance, the reviewer who contributed the least amount of feedback rated 20 movies while the most active reviewer submitted nearly 2400 ratings, whose individual contribution accounts for approximately 2.5% of the total reviews. We also see that some users are more prone to leave positive reviews while other users are quite the opposite; the highest reviewer’s mean rating is 4.95/5.0 while the lowest reviewer’s mean rating came in at 1.33/5.0.
The next step is to analyze how ratings apply to the films in question. Performing simple analysis on our dataset, we find that every movie has at least one review and the mean number of reviews per movie is about 11. We also see that the mean rating for a movie is 3.29, which is lower than the mean rating that a reviewer submitted. This is evidenced when we view a histogram of movie mean ratings and find spikes appearing at the .5 increments. This is because so many of our movies in the dataset only have 1 or 2 reviews.
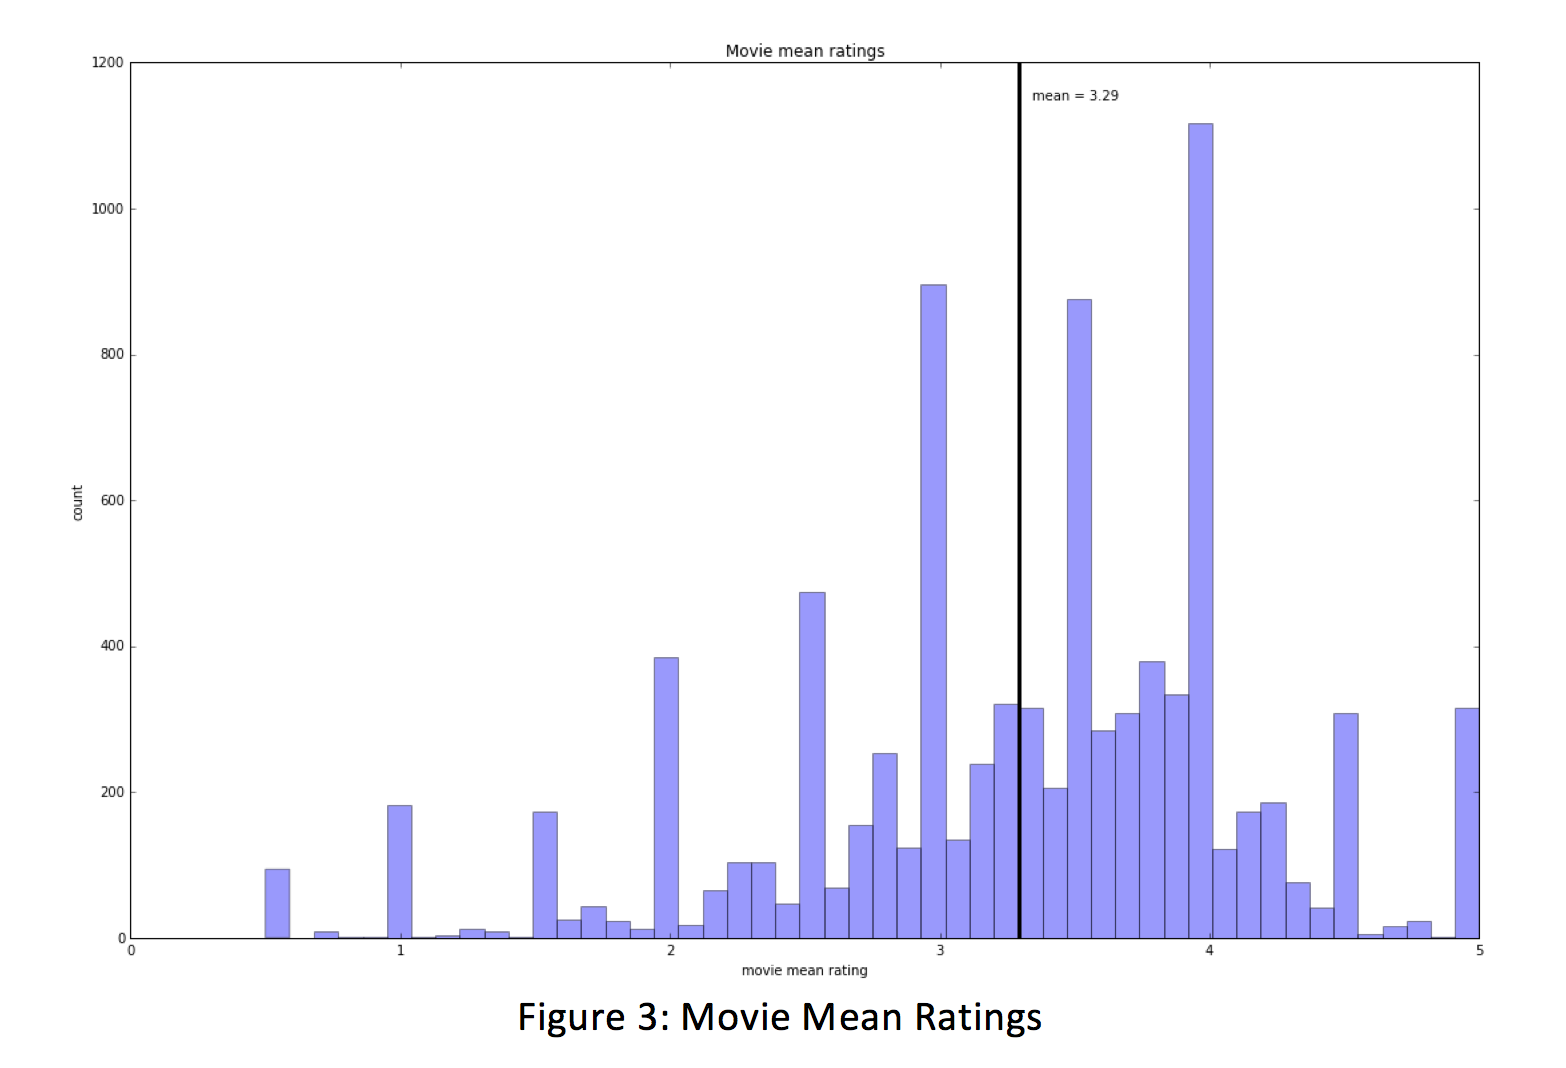
This leads us into another point of interest. Unfortunately, nearly 50% of the movies only have between 1 and 2 reviews. This is particularly concerning because these movies may be rated extremely high (or low) by one or two reviewers, which could affect how well our recommendation model works if we do not take this into account. Because of this realization, we fully expect to introduce prior beliefs into our model to adjust. For instance, when we recommend a similar movie to a user, we could return a short list of films instead of populating every movie that might qualify, especially if films might only have 1 to 2 reviews.
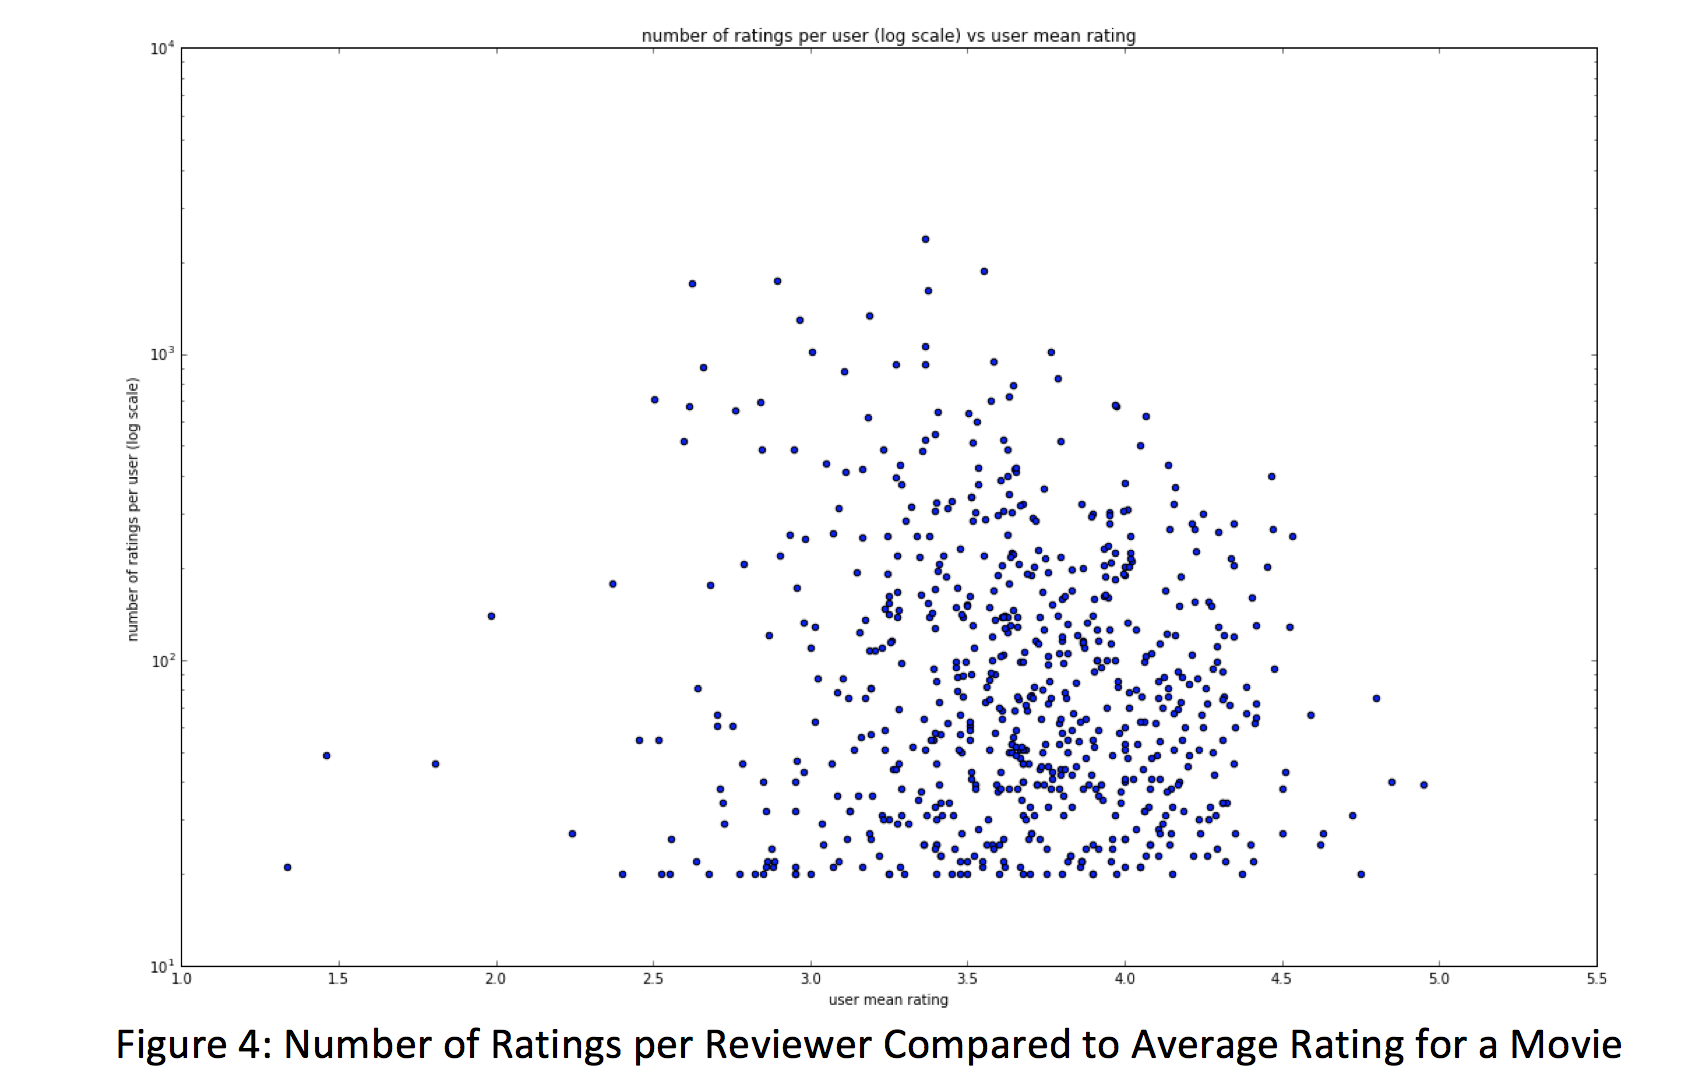
Using a log scale to adjust for a less skewed distribution, we do find another interesting aspect of the data when we compare the number of ratings per user and the user mean rating. We find that the more ratings we have from a user (i.e., greater than 10 ratings), the higher the likelihood that their average rating will gravitate toward our mean (between 3.0 and 3.5).
Using a similar comparison for the number of ratings per movie and the mean movie rating, we find that the more ratings we have per movie, the more likely the rating for the movie will be higher. This suggests that reviews are more prone to review movies they like than those they didn’t like.

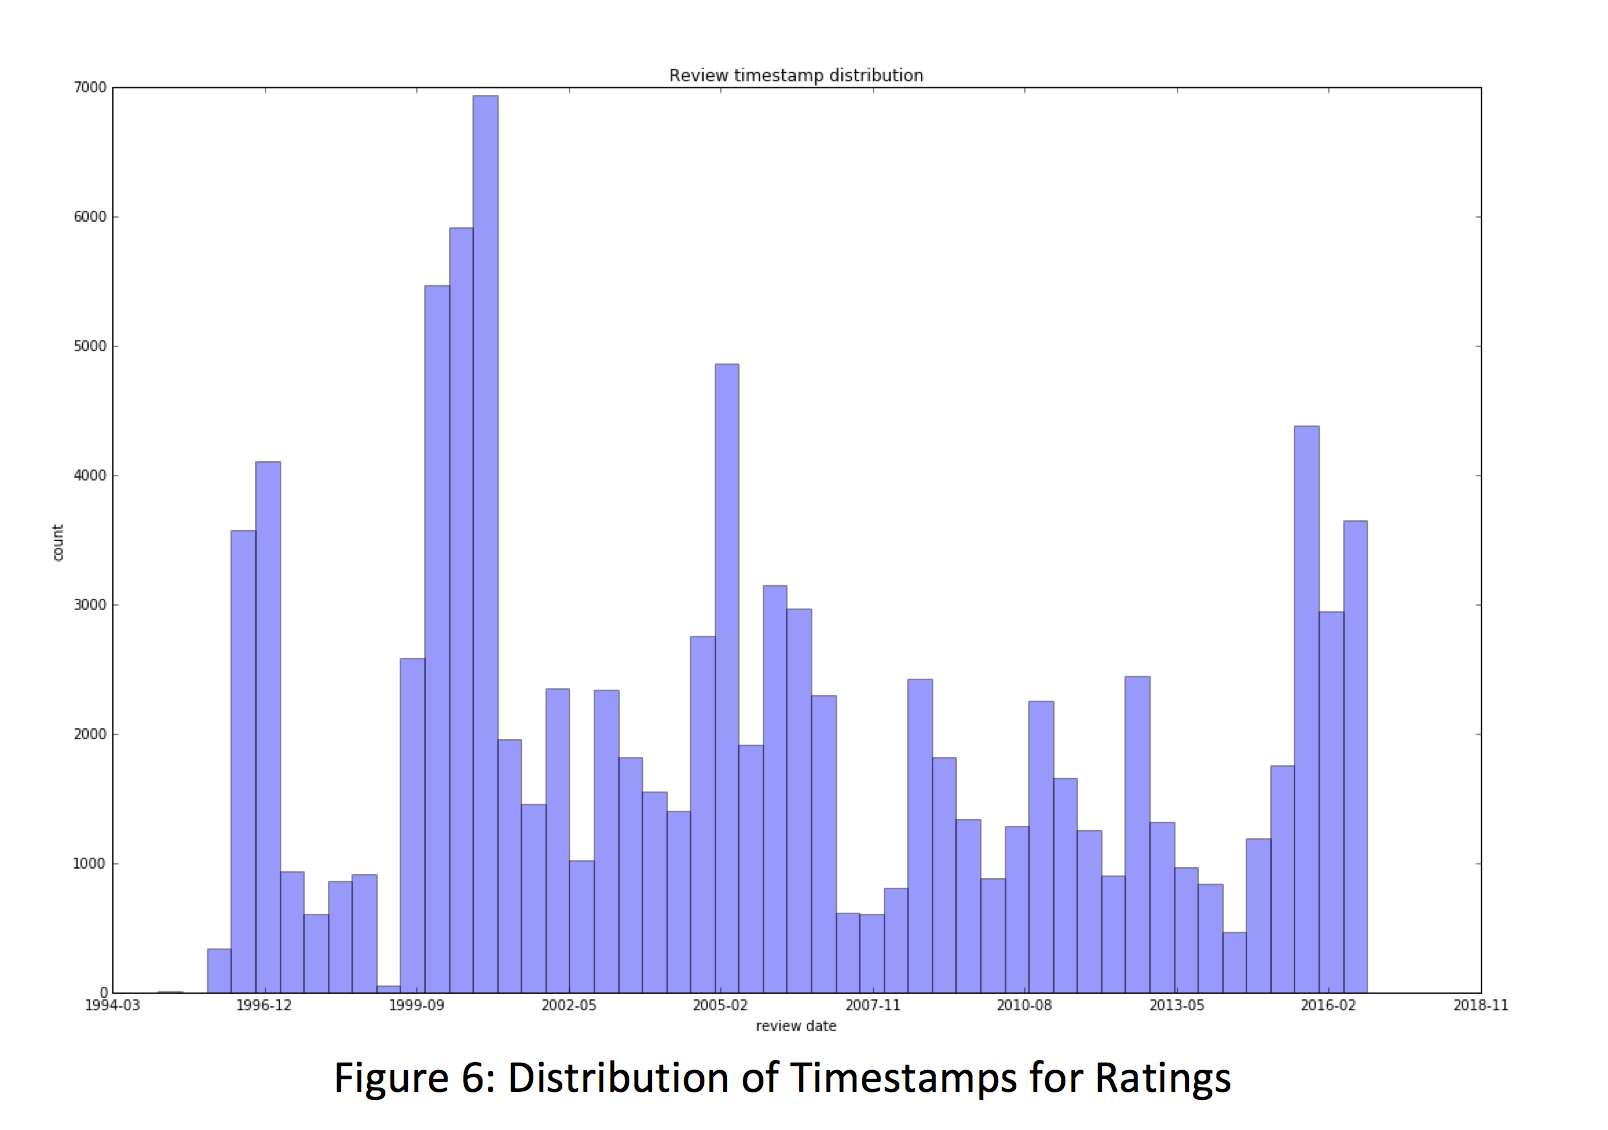
When reviewing the dataset, we found some other areas that we wanted to explore. The first was the range of dates for reviews. The theory is that when a movie was watched and subsequently reviewed might have an impact on the rating. For this reason, we plotted the timestamps of the reviews in a histogram to see when they were submitted. It appears that the ratings were submitted cyclically and that the highest frequency of submissions occurred near the later part of 1999. Although this was not enough to establish our theory, we could take this visualization and compare it to the production years of the films to determine if it had an impact on the rating.
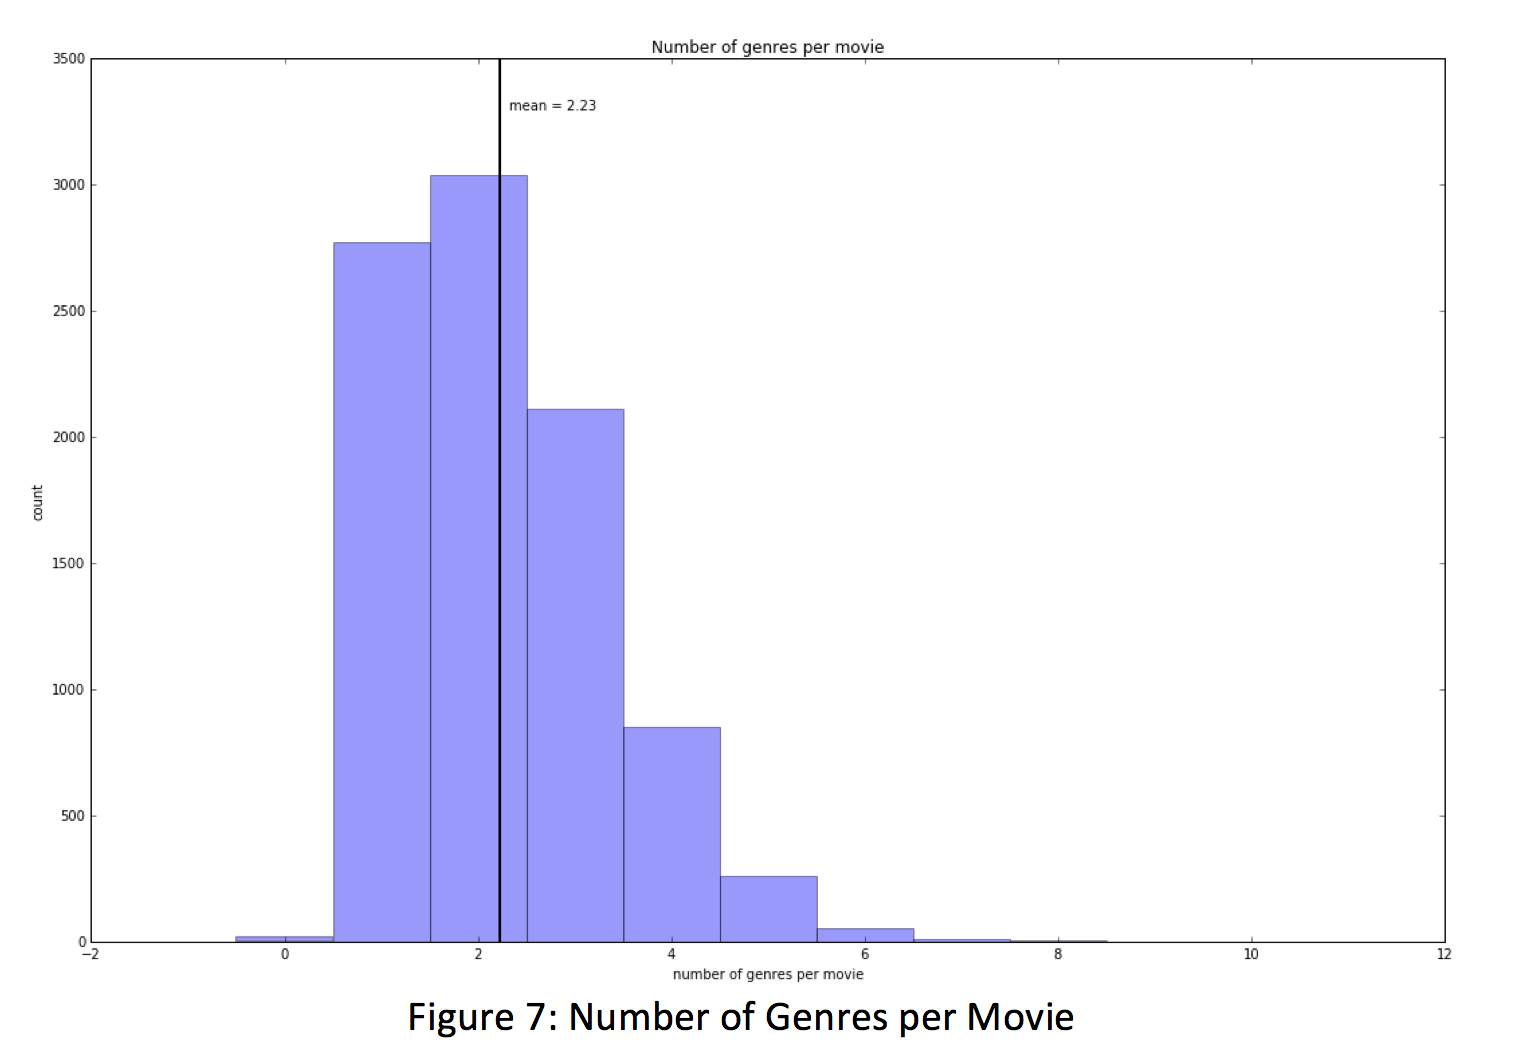
The last area we explored pertained to the genres of the films. We found that there were 19 distinct genres accounted for in the movies (with a 20th originally determined to be ‘no genres listed’), the maximum number of attributed genres for a film came in at 10 (which seems pretty high), 18 films were not tagged with any genre, and the mean number of genres per film was 2 and 1/4. The mean seems to make sense as many films are a combination of a few genres, as this helps the movie appeal to more viewers.
We determined that the most popular drama, both in number of movies and number of ratings, was drama, followed closely by comedy. Following this same train of thought, we discovered an interesting relationship among the third and fourth place genres; action is in third place for number of ratings, but it's 4th in the number of movies per genre, falling behind thrillers. In essence, action movies are more popular (have more ratings) but there are more thriller movies available for customers.
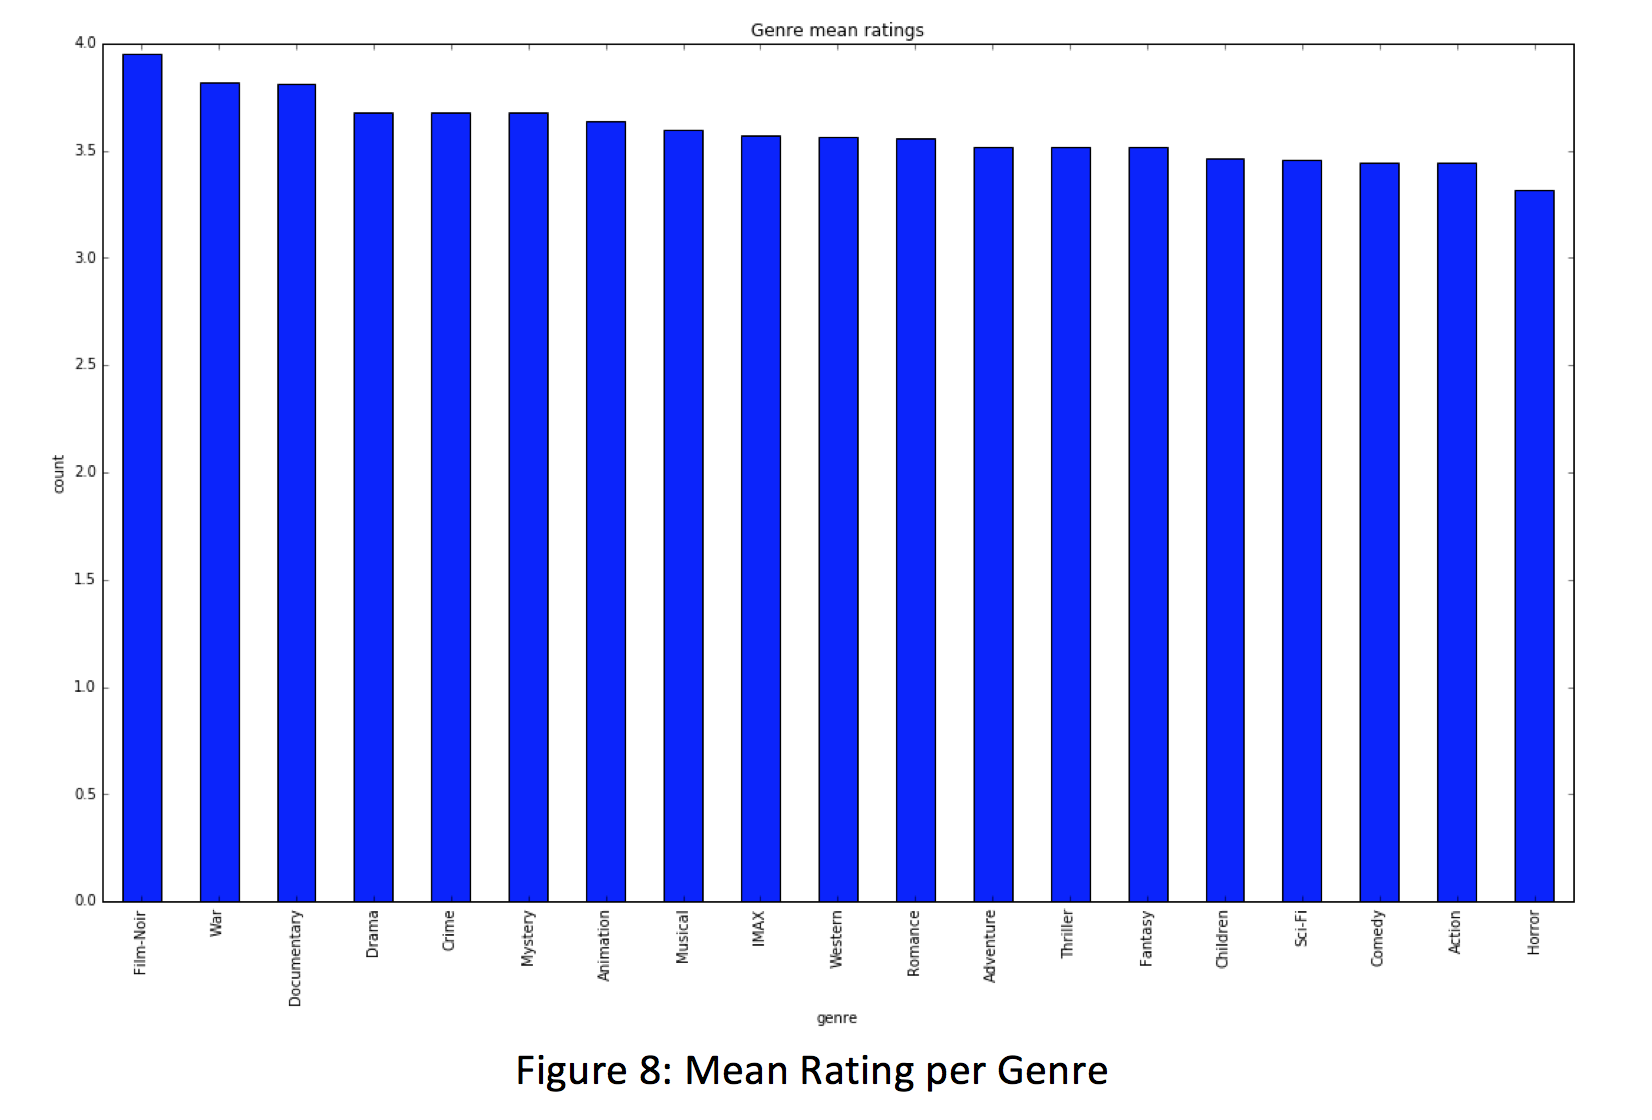
Another interesting find involved documentaries, war, and film-noir genre films. Each of these genres is on the lower end of the spectrum when it comes to the number of ratings per genre and the number of movies per genre, but we find that they rank right near the top in average rating per genre. We suspect this is because these genres tend to attract special interest groups that are particularly supportive of their preferences, and may feel more inclined to highly review these genres. This is important to note - if one of these genres is highly liked by a user, there may be a good chance that they’re eager to see another film in this space again. We imagine this is another space that prior beliefs may adjust our model to be a better fit.